πŸ†XenFootprint

Indicator πŸ†XenFootprint

  • Thread starter Thread starter Mark
  • Start date Start date
  • Featured
Status
Not open for further replies.
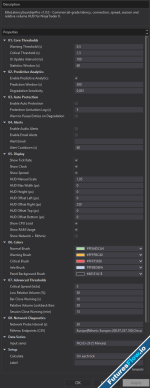
1771337146479.png


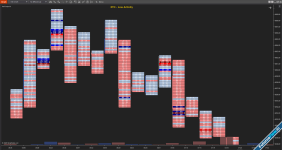
πŸ”₯ XenFootprint – The 4-Level Visual Footprint System​


Most footprint indicators show numbers.
Some add basic coloring.


XenFootprint is engineered around visual decision speed. ⚑
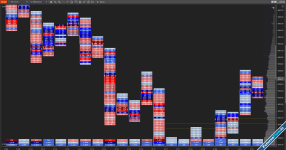
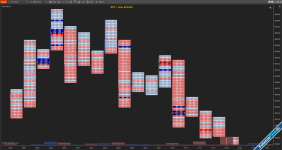
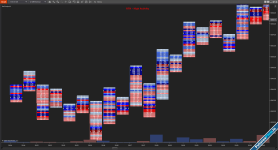
Its core advantage is a structured 4-Level Color Engine that transforms raw bid Γ— ask data into instantly readable intensity zones β€” so traders can identify aggression, dominance, and imbalance strength without overanalyzing numbers.


eth.PNG
rth.PNG

🧠 Designed for Visual Order Flow Traders​


In fast markets, traders don’t have time to compare ratios manually.

XenFootprint automatically normalizes volume and delta data into four clear intensity levels:

🟦 Level 1 – Light participation
🟦 Level 2 – Moderate activity
🟦 Level 3 – Strong participation
🟦 Level 4 – Extreme aggression

This applies dynamically across visible bars, allowing the chart to adapt to current market conditions instead of relying on static thresholds.

The result:

βœ” Faster decision making
βœ” Clearer dominance recognition
βœ” Reduced cognitive load
βœ” Immediate identification of aggressive participation


🎨 Volume Levels & Imbalance Levels​

Two modes. Two different reads of the market.

πŸ“Š Volume Levels​


Shows where participation was strongest inside the bar.

Use it when you want to spot:

πŸ“ High-activity price zones
πŸ“ Absorption areas
πŸ“ Strong auction development
πŸ“ Liquidity acceptance

Best for:
βœ” Structure traders
βœ” Auction market traders
βœ” Scalpers watching intrabar volume

You instantly see where the market was active.


⚑ Imbalance Levels​


Highlights aggressive dominance between buyers and sellers.

Use it when you want to spot:

πŸ”₯ Initiative buying
πŸ”» Aggressive selling
βš” Control shifts
πŸš€ Momentum building

Best for:
βœ” Breakout traders
βœ” Momentum scalpers
βœ” Stacked imbalance traders

You instantly see who’s pressing the market.


⚑ One-Click Activation

β”Œβ”€β”€β”€β”€β”€β”€β”€β”€β”€β”€β”€β”€β”€β”€β”€β”€β”€β”€β”€β”€β”€β”€β”€β”€β”€β”€β”€β”€β”€β”€β”€β”
β”‚ SHOW FOOTPRINT β”‚ HIDE FOOTPRINT β”‚
β”‚ [Shift+Space] β”‚ [Shift+Space] β”‚
β””β”€β”€β”€β”€β”€β”€β”€β”€β”€β”€β”€β”€β”€β”€β”€β”€β”€β”€β”€β”€β”€β”€β”€β”€β”€β”€β”€β”€β”€β”€β”€β”˜

Toggle footprint view instantly with customizable hotkeys. Switch between regular charts and footprint view without losing your settings.​


🎯 Min Volume Filter – Cleaner, Smarter Footprint​


Not every printed trade matters.

The Min Volume Filter removes low-volume noise by applying a minimum threshold to each price level.

πŸ”Ž How It Works​

If volume at a price level is below your defined threshold:

➑ It is automatically displayed as Level 1 colour (lowest intensity)
➑ It does not get highlighted as significant activity
➑ It reduces visual clutter inside the bar

Only meaningful participation stands out.

πŸ“¦ Other Key Features​

πŸ”Ή Tick Aggregation Control – Group price levels for cleaner structure and reduced noise.​
πŸ”Ή Integrated Session Volume Profile – Real-time POC, VAH, VAL with automatic value area calculation.​
πŸ”Ή Auto Chart Scaling Adjustment – Optimized bar width and spacing when footprint is enabled.​
πŸ”Ή Per-Bar Summary Statistics – Total volume, bar delta, cumulative delta tracking.​
πŸ”Ή Delta Profile Mode – Visual delta intensity inside each bar.​
πŸ”Ή Stacked Imbalance Detection – Identifies consecutive aggressive dominance zones.​
πŸ”Ή Cumulative Swing Delta – Tracks delta shifts across structural swings.​
πŸ”Ή Per-Bar Volume & Delta Toggle – Display key stats directly on the chart.​
πŸ”Ή Bottom Panel (Delta / Volume) – Histogram-style visualization below price.​
πŸ”Ή Hotkey Toggle (Show/Hide) – Instantly switch between footprint and regular view.​
πŸ”Ή Custom Scroll & Zoom Control – Smooth zooming with footprint layout preservation.​


More Upgraded version : https://futuresflow.io/forums/delta-flowprint.27/
Rebranded to Delta Flowprint

Built with πŸ’™ for traders.

 
Last edited:
Could I try the indicator . I got the secret license but no the indicator
 
1771337146479.png

πŸ”₯ XenFootprint – The 4-Level Visual Footprint System​


Most footprint indicators show numbers.
Some add basic coloring.


XenFootprint is engineered around visual decision speed. ⚑
Its core advantage is a structured 4-Level Color Engine that transforms raw bid Γ— ask data into instantly readable intensity zones β€” so traders can identify aggression, dominance, and imbalance strength without overanalyzing numbers.


eth.PNGrth.PNG

🧠 Designed for Visual Order Flow Traders​


In fast markets, traders don’t have time to compare ratios manually.

XenFootprint automatically normalizes volume and delta data into four clear intensity levels:

🟦 Level 1 – Light participation
🟦 Level 2 – Moderate activity
🟦 Level 3 – Strong participation
🟦 Level 4 – Extreme aggression

This applies dynamically across visible bars, allowing the chart to adapt to current market conditions instead of relying on static thresholds.

The result:

βœ” Faster decision making
βœ” Clearer dominance recognition
βœ” Reduced cognitive load
βœ” Immediate identification of aggressive participation


🎨 Volume Levels & Imbalance Levels​

Two modes. Two different reads of the market.

πŸ“Š Volume Levels​


Shows where participation was strongest inside the bar.

Use it when you want to spot:

πŸ“ High-activity price zones
πŸ“ Absorption areas
πŸ“ Strong auction development
πŸ“ Liquidity acceptance

Best for:
βœ” Structure traders
βœ” Auction market traders
βœ” Scalpers watching intrabar volume

You instantly see where the market was active.


⚑ Imbalance Levels​


Highlights aggressive dominance between buyers and sellers.

Use it when you want to spot:

πŸ”₯ Initiative buying
πŸ”» Aggressive selling
βš” Control shifts
πŸš€ Momentum building

Best for:
βœ” Breakout traders
βœ” Momentum scalpers
βœ” Stacked imbalance traders

You instantly see who’s pressing the market.


View attachment 434

⚑ One-Click Activation

β”Œβ”€β”€β”€β”€β”€β”€β”€β”€β”€β”€β”€β”€β”€β”€β”€β”€β”€β”€β”€β”€β”€β”€β”€β”€β”€β”€β”€β”€β”€β”€β”€β”
β”‚ SHOW FOOTPRINT β”‚ HIDE FOOTPRINT β”‚
β”‚ [Shift+Space] β”‚ [Shift+Space] β”‚
β””β”€β”€β”€β”€β”€β”€β”€β”€β”€β”€β”€β”€β”€β”€β”€β”€β”€β”€β”€β”€β”€β”€β”€β”€β”€β”€β”€β”€β”€β”€β”€β”˜

Toggle footprint view instantly with customizable hotkeys. Switch between regular charts and footprint view without losing your settings.​


🎯 Min Volume Filter – Cleaner, Smarter Footprint​


Not every printed trade matters.

The Min Volume Filter removes low-volume noise by applying a minimum threshold to each price level.

πŸ”Ž How It Works​

If volume at a price level is below your defined threshold:

➑ It is automatically displayed as Level 1 colour (lowest intensity)
➑ It does not get highlighted as significant activity
➑ It reduces visual clutter inside the bar

Only meaningful participation stands out.

πŸ“¦ Other Key Features​

πŸ”Ή Tick Aggregation Control – Group price levels for cleaner structure and reduced noise.​
πŸ”Ή Integrated Session Volume Profile – Real-time POC, VAH, VAL with automatic value area calculation.​
πŸ”Ή Auto Chart Scaling Adjustment – Optimized bar width and spacing when footprint is enabled.​
πŸ”Ή Per-Bar Summary Statistics – Total volume, bar delta, cumulative delta tracking.​
πŸ”Ή Delta Profile Mode – Visual delta intensity inside each bar.​
πŸ”Ή Stacked Imbalance Detection – Identifies consecutive aggressive dominance zones.​
πŸ”Ή Cumulative Swing Delta – Tracks delta shifts across structural swings.​
πŸ”Ή Per-Bar Volume & Delta Toggle – Display key stats directly on the chart.​
πŸ”Ή Bottom Panel (Delta / Volume) – Histogram-style visualization below price.​
πŸ”Ή Hotkey Toggle (Show/Hide) – Instantly switch between footprint and regular view.​
πŸ”Ή Custom Scroll & Zoom Control – Smooth zooming with footprint layout preservation.​


πŸ” Get Your LicenseπŸ†“

Activate XenFootprint here:
πŸ‘‰ https://tradxfi.com/account/license
Built with πŸ’™ for traders.

How can I get the Delta value which shows on top and bottom of the bar. I need to put alert system on it is it easy to calculate on ninjascript?
 
1771337146479.png

πŸ”₯ XenFootprint: El sistema de huella visual de 4 niveles​


La mayorΓ­a de los indicadores de huella muestran nΓΊmeros.
Algunos aΓ±aden coloraciΓ³n bΓ‘sica.


XenFootprint estÑ diseñado para acelerar la toma de decisiones visuales. ⚑
Su principal ventaja reside en un motor de color estructurado de 4 niveles que transforma los datos brutos de oferta y demanda en zonas de intensidad fΓ‘cilmente legibles, lo que permite a los operadores identificar la agresividad, el dominio y la fuerza del desequilibrio sin sobreanalizar las cifras.


eth.PNGrth.PNG

🧠 DiseΓ±ado para operadores que visualizan el flujo de Γ³rdenes.​


En mercados volΓ‘tiles, los operadores no tienen tiempo para comparar ratios manualmente.

XenFootprint normaliza automΓ‘ticamente los datos de volumen y delta en cuatro niveles de intensidad claros:

🟦 Nivel 1 – ParticipaciΓ³n ligera
🟦 Nivel 2 – Actividad moderada
🟦 Nivel 3 – Fuerte participaciΓ³n
🟦 Nivel 4 – AgresiΓ³n extrema

Esto se aplica de forma dinΓ‘mica a todas las barras visibles, lo que permite que el grΓ‘fico se adapte a las condiciones actuales del mercado en lugar de depender de umbrales estΓ‘ticos.

El resultado:

βœ” Toma de decisiones mΓ‘s rΓ‘pida
βœ” Reconocimiento de dominio mΓ‘s claro
βœ” Carga cognitiva reducida
βœ” IdentificaciΓ³n inmediata de participaciΓ³n agresiva


🎨 Niveles de volumen y niveles de desequilibrio​

Dos modos. Dos interpretaciones diferentes del mercado.

πŸ“Š Niveles de volumen​


Muestra dΓ³nde hubo mayor participaciΓ³n dentro del bar.

Úsalo cuando quieras detectar:

πŸ“ Zonas de precios de alta actividad
πŸ“ Áreas de absorciΓ³n
πŸ“ Fuerte desarrollo de subastas
πŸ“ AceptaciΓ³n de liquidez

Ideal para:
βœ” Operadores de estructuras
βœ” Comerciantes del mercado de subastas
βœ” Los revendedores vigilan el volumen intrabar

Se puede ver al instante dΓ³nde estuvo activo el mercado.


⚑ Niveles de desequilibrio​


Destaca el dominio agresivo entre compradores y vendedores.

Úsalo cuando quieras detectar:

πŸ”₯ Compra por iniciativa
πŸ”» Venta agresiva
βš” Cambios de control
πŸš€ GeneraciΓ³n de impulso

Ideal para:
βœ” Operadores de ruptura
βœ” Revendedores de impulso
βœ” Traders con desequilibrio apilado

Enseguida se ve quiΓ©n estΓ‘ presionando el mercado.


View attachment 434

⚑ Activación con un solo clic

β”Œβ”€β”€β”€β”€β”€β”€β”€β”€β”€β”€β”€β”€β”€β”€β”€β”€β”€β”€β”€β”€β”€β”€β”€β”€β”€β”€β”€β”€β”€β”€β”€β”
β”‚ MOSTRAR HUELLA β”‚ OCULTAR HUELLA β”‚
β”‚ [MayΓΊs+Espacio] β”‚ [MayΓΊs+Espacio] β”‚
β””β”€β”€β”€β”€β”€β”€β”€β”€β”€β”€β”€β”€β”€β”€β”€β”€β”€β”€β”€β”€β”€β”€β”€β”€β”€β”€β”€β”€β”€β”€β”€β”˜

Cambia instantΓ‘neamente la vista de huella con teclas de acceso rΓ‘pido personalizables. Alterna entre grΓ‘ficos normales y la vista de huella sin perder tu configuraciΓ³n.​


🎯 Filtro de volumen mΓ­nimo: una huella ecolΓ³gica mΓ‘s limpia e inteligente.​


No todos los anuncios impresos importan.

El filtro de volumen mΓ­nimo elimina el ruido de bajo volumen aplicando un umbral mΓ­nimo a cada nivel de precio.

πŸ”Ž CΓ³mo funciona​

Si el volumen a un nivel de precio estΓ‘ por debajo del umbral definido:

➑ Se muestra automÑticamente como color de nivel 1 (intensidad mÑs baja).
➑ No se destaca como una actividad significativa
➑ Reducir el desorden visual dentro del bar.

Solo destaca la participaciΓ³n significativa.

πŸ“¦ Otras caracterΓ­sticas clave​

πŸ”Ή Control de agregaciΓ³n de ticks : agrupa los niveles de precios para una estructura mΓ‘s clara y una reducciΓ³n del ruido.​
πŸ”Ή Perfil de volumen de sesiΓ³n integrado : POC, VAH, VAL en tiempo real con cΓ‘lculo automΓ‘tico del Γ‘rea de valor.​
πŸ”Ή Ajuste automΓ‘tico de la escala del grΓ‘fico : ancho y espaciado de las barras optimizados cuando la opciΓ³n "huella" estΓ‘ habilitada.​
πŸ”Ή EstadΓ­sticas resumidas por barra : volumen total, delta de la barra, seguimiento delta acumulado.​
πŸ”Ή Modo Perfil Delta : Intensidad delta visual dentro de cada barra.​
πŸ”Ή DetecciΓ³n de desequilibrio apilado : identifica zonas de dominancia agresivas consecutivas.​
πŸ”Ή Delta de oscilaciΓ³n acumulativa : registre los cambios delta a travΓ©s de oscilaciones estructurales.​
πŸ”Ή Volumen por barra y delta (conmutaciΓ³n ): muestra las estadΓ­sticas clave directamente en el grΓ‘fico.​
πŸ”Ή Panel inferior (Delta / Volumen) : visualizaciΓ³n tipo histograma debajo del precio.​
πŸ”Ή Alternancia mediante teclas de acceso rΓ‘pido (mostrar/ocultar) : cambia instantΓ‘neamente entre la vista en miniatura y la vista normal.​
πŸ”Ή Control de desplazamiento y zoom personalizado : zoom fluido que conserva el diseΓ±o original.​


πŸ” ObtΓ©n tu licenciaπŸ†“

Active XenFootprint aquΓ­:
πŸ‘‰ https://tradxfi.com/account/license
DiseΓ±ado πŸ’™ para operadores.

Buenas soy nuevo, como consigo esa
Llevo mΓ‘s de dos aΓ±os buscando este tipo de diseΓ±o y, finalmente, decidΓ­ construirlo yo mismo.

Creo sinceramente que esta es la plataforma mΓ‘s completa y sofisticada que un operador puede utilizar. EstΓ‘ inspirada en la plataforma Market Delta y en el tipo de herramientas que utilizan los operadores de las principales firmas de trading.

Y su uso es totalmente gratuito.

En el futuro, es posible que desarrolle un sistema de negociaciΓ³n automatizado basado especΓ­ficamente en este marco de referencia.

Si encuentra algΓΊn error o tiene sugerencias para mejorar, por favor, comparta sus comentarios.
Y si te resulta ΓΊtil, comparte este foro para ayudar a otros operadores.

Β‘Buena suerte y que te vaya bien en tus operaciones!
Buenas, soy nuevo, despuΓ©s de mucho buscar di con esto πŸ™, como puedo conseguirlo, cuando le doy al enlace me da error ,gracias
 
When will we be able to try it? Great job!πŸ‘Œ
i have soo much in my mind, to make this final footprint trader can use. fully customizable including the levels to plot and alert system. may take a bit time maybe till next week..
 
1771337146479.png

πŸ”₯ XenFootprint – The 4-Level Visual Footprint System​


Most footprint indicators show numbers.
Some add basic coloring.


XenFootprint is engineered around visual decision speed. ⚑
Its core advantage is a structured 4-Level Color Engine that transforms raw bid Γ— ask data into instantly readable intensity zones β€” so traders can identify aggression, dominance, and imbalance strength without overanalyzing numbers.


eth.PNGrth.PNG

🧠 Designed for Visual Order Flow Traders​


In fast markets, traders don’t have time to compare ratios manually.

XenFootprint automatically normalizes volume and delta data into four clear intensity levels:

🟦 Level 1 – Light participation
🟦 Level 2 – Moderate activity
🟦 Level 3 – Strong participation
🟦 Level 4 – Extreme aggression

This applies dynamically across visible bars, allowing the chart to adapt to current market conditions instead of relying on static thresholds.

The result:

βœ” Faster decision making
βœ” Clearer dominance recognition
βœ” Reduced cognitive load
βœ” Immediate identification of aggressive participation


🎨 Volume Levels & Imbalance Levels​

Two modes. Two different reads of the market.

πŸ“Š Volume Levels​


Shows where participation was strongest inside the bar.

Use it when you want to spot:

πŸ“ High-activity price zones
πŸ“ Absorption areas
πŸ“ Strong auction development
πŸ“ Liquidity acceptance

Best for:
βœ” Structure traders
βœ” Auction market traders
βœ” Scalpers watching intrabar volume

You instantly see where the market was active.


⚑ Imbalance Levels​


Highlights aggressive dominance between buyers and sellers.

Use it when you want to spot:

πŸ”₯ Initiative buying
πŸ”» Aggressive selling
βš” Control shifts
πŸš€ Momentum building

Best for:
βœ” Breakout traders
βœ” Momentum scalpers
βœ” Stacked imbalance traders

You instantly see who’s pressing the market.


View attachment 434

⚑ One-Click Activation

β”Œβ”€β”€β”€β”€β”€β”€β”€β”€β”€β”€β”€β”€β”€β”€β”€β”€β”€β”€β”€β”€β”€β”€β”€β”€β”€β”€β”€β”€β”€β”€β”€β”
β”‚ SHOW FOOTPRINT β”‚ HIDE FOOTPRINT β”‚
β”‚ [Shift+Space] β”‚ [Shift+Space] β”‚
β””β”€β”€β”€β”€β”€β”€β”€β”€β”€β”€β”€β”€β”€β”€β”€β”€β”€β”€β”€β”€β”€β”€β”€β”€β”€β”€β”€β”€β”€β”€β”€β”˜

Toggle footprint view instantly with customizable hotkeys. Switch between regular charts and footprint view without losing your settings.​


🎯 Min Volume Filter – Cleaner, Smarter Footprint​


Not every printed trade matters.

The Min Volume Filter removes low-volume noise by applying a minimum threshold to each price level.

πŸ”Ž How It Works​

If volume at a price level is below your defined threshold:

➑ It is automatically displayed as Level 1 colour (lowest intensity)
➑ It does not get highlighted as significant activity
➑ It reduces visual clutter inside the bar

Only meaningful participation stands out.

πŸ“¦ Other Key Features​

πŸ”Ή Tick Aggregation Control – Group price levels for cleaner structure and reduced noise.​
πŸ”Ή Integrated Session Volume Profile – Real-time POC, VAH, VAL with automatic value area calculation.​
πŸ”Ή Auto Chart Scaling Adjustment – Optimized bar width and spacing when footprint is enabled.​
πŸ”Ή Per-Bar Summary Statistics – Total volume, bar delta, cumulative delta tracking.​
πŸ”Ή Delta Profile Mode – Visual delta intensity inside each bar.​
πŸ”Ή Stacked Imbalance Detection – Identifies consecutive aggressive dominance zones.​
πŸ”Ή Cumulative Swing Delta – Tracks delta shifts across structural swings.​
πŸ”Ή Per-Bar Volume & Delta Toggle – Display key stats directly on the chart.​
πŸ”Ή Bottom Panel (Delta / Volume) – Histogram-style visualization below price.​
πŸ”Ή Hotkey Toggle (Show/Hide) – Instantly switch between footprint and regular view.​
πŸ”Ή Custom Scroll & Zoom Control – Smooth zooming with footprint layout preservation.​


πŸ” Get Your LicenseπŸ†“

Activate XenFootprint here:
πŸ‘‰ https://tradxfi.com/account/license
thanks for your amazing effort , but where is the download link?
 
Status
Not open for further replies.
Back
Top Bottom