Range Volume Profile NT8 — Handbook
Range Volume Profile NT8 — Handbook
Discretionary Trading Tools — discotrading.com · Copyright © Novasoft LLC · Full illustrated reference
Overview
Range Volume Profile NT8 (RVP) is a versatile visual tool for profiling trading activity in NinjaTrader 8, aimed at discretionary traders. As a visual tool it is meant to let you observe the market from various perspectives and to help you discover and develop your own trading ideas.Range Volume Profile can plot both classic periodic volume profiles (Daily, Sessional, Weekly, etc.) and adjustable profiles over a custom time range. The Composite profile provides a basic overview of trading-activity peaks and valleys in general, and can display high- and low-volume node levels as well.
The base functional structure:
Three types of profiles by underlying metric
- Volume-based — Volume at Price
- Tick-based — Trades Qty at Price
- Average Trade Size (ATS) histogram
Three kinds of profiles by period representation
- Adjustable Custom Range Profiles
- Classic Periodic Profiles (Sessional, Daily, Weekly, etc.)
- Composite Profile
Precise and Fast Profiling
There are two sorts of Data Source options for building historical profiles: based on precise 1-tick data, and based on less granular 1-minute data. Use tick-granularity Data Sources for highest accuracy and "Minute Series" for faster start-up computations. While "Minute Series" is particularly intended for long-term charts, it is also viable for intraday trading.Delta at Price
Volume (or Tick) Delta histogram bars (Δ-bars) can be plotted along with Volume (Tick) Profiles.Remember! Δ-bars have different meaning in "Minute Series" Data Source mode. Standard delta calculation is impossible when the Data Source is "Minute Series"; in that case the volume of Up (bullish) 1-minute data points is treated as positive and Down (bearish) as negative. This kind of delta is called Pseudo-Delta in RVP.
Various Delta calculation techniques
- Bid vs Ask (default mode)
- Up Tick vs Down Tick
- Pseudo-Delta (for "fast" profiles built from minute-series data)
Value Area
Developing and Naked Value Area price levels can be plotted for both Periodic and Custom Range Profiles.Open Range & Initial Balance
Plotting of Open Range and Initial Balance price levels is available, with customizable periods of formation and beginning time of day.VWAP & Standard Deviation
VWAP and VWAP Standard Deviation Bounds can be plotted along with Periodic and Custom Range Profiles.Volume Nodes
Highlighting of High-Volume Node histogram bars can be enabled for any profile. High & Low Volume Nodes (or High & Low Tick Nodes for Tick Profiles) of the Composite Profile can be plotted as price levels.Settings structure
The settings structure is classified into four big groups for easier orientation:Core properties — options related to data processing and the most general parameters that have overall action:
- '0. General Settings' section
- '1. Appearance Settings' section (overall appearance)
- '1.2. PPs Appearance Settings' section (for Periodic Profiles if checked)
- '1.3. CP Appearance Settings' section (for Composite Profile if checked)
- '1.4. RPs Appearance Settings' section (for Custom Range Profiles if checked)
- '2. Periodic Profiles (PPs)' section
- '3. Composite Profile' section
- '4. Range Profiles' section
- '5. Misc Settings' section
RVP Control Panel
The RVP Control Panel provides the easiest control over the most frequently used properties — any change made through it is reflected on the chart immediately (on-the-fly).Press the RVP toolbar button to open the RVP Control Panel.
Tip: if you use several instances of the RVP indicator with different settings on the same chart, set a different Instance Color for each instance to manage them more easily. The Instance Color affects UI elements related to a particular indicator instance: the RVP toolbar button and context-menu items.
Shortcut Keys
In addition to the RVP Control Panel you can use a set of shortcut keys. The default combinations can be redefined in the indicator properties window.Shortcut keys for Periodic Profiles
2. Periodic Profiles (PPs) settings section → Shortcut keys group- Toggle Visibility of Periodic Profiles — [Alt + P]
- Histograms horizontal scale: Increase [Ctrl + Plus], Decrease [Ctrl + Minus], Reset [Ctrl + Multiply]
- Toggle Comparative Widths Mode — [Backspace]
- Toggle Labels Style of Price Levels — [Ctrl + A]
- Toggle Extension of Value Area Levels — [Ctrl + Shift + A]
Shortcut keys for Custom Range Profiles
4. Range Profiles settings section → Shortcut keys group- Toggle Visibility of all custom range profiles — undefined by default
- Start creating new range profile — [Insert]
- Remove all custom range profiles — undefined by default
- Histograms horizontal scale: Increase [Ctrl + Alt + Plus], Decrease [Ctrl + Alt + Minus], Reset [Ctrl + Alt + Multiply]
- Toggle Labels Style of Price Levels — [Ctrl + A]
- Toggle Extension of Value Area Levels — [Ctrl + Shift + A]
- Toggle Ascetic Mode — [Ctrl + Alt + Divide]
General Settings
Both the General and Appearance settings groups are generic to all kinds of profiles (Custom Range, Periodic, Composite).Tolerance Interval
The tolerance interval defines the Value Area — a price range within which the specified percentage of total volume (or total number of trades for Tick Profiles) is distributed. The value of about 70%, which represents one standard deviation of the mean in a normal (Gaussian) distribution, is the most commonly used tolerance interval.Data Source
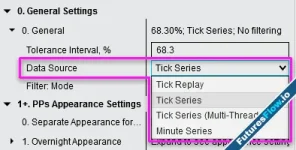
Sets which data-source type to use to gather historical data.- "Tick Series" (default) — internally uses the most generic way of obtaining 1-tick-level granularity in NinjaTrader 8.
- "Tick Series (Multi-Threaded)" — almost the same, but RVP uses all available processor cores to speed up gathering historical tick data on start-up when possible. Useful for deep-history charts. However, CPU load may reach 100% on start-up, which can be undesirable if working in the background while RVP prepares tick data. Prefer the default "Tick Series" for short-term intraday charts (Days to load < 60 days).
- "Tick Replay" — an alternative way of obtaining historical 1-tick data introduced in NinjaTrader 8, added for compatibility, since some 3rd-party indicators require the Tick Replay feature enabled on the chart's data series to obtain tick data. For example, if you use RVP alongside an indicator that only works in Tick Replay mode on the same chart, you must switch RVP's Data Source to "Tick Replay" too. In Tick Replay mode, NinjaTrader plays back historical ticks (tick by tick) to build bars as if they had been built live, and sends those ticks to indicators, which then receive precise 1-tick data.
Important:
! Make sure you have checked the 'Tick Replay' option in the Data Series window when RVP's Data Source is set to "Tick Replay".
! Make sure you have unchecked the 'Tick Replay' option in the Data Series window if RVP's Data Source is anything other than "Tick Replay".
- "Minute Series" — the fastest Data Source. RVP uses 1-minute historical data to build profiles. This is less accurate but precise enough even for intraday trading, and is mostly intended for long-term / deep historical charts (Days to load > 100 days).
[Volume Pseudo-Δ] = [Volume of Bullish 1-Min intervals] − [Volume of Bearish 1-Min intervals] (for the period of the profile)
Also, computations of Tick Profiles and ATS Histograms are based on counting 1-minute data points. The Filter By Trade Size functionality is unavailable for the Minute Data Source.
Delta Mode
Specifies which technique of initiative-trade-side determination to use for Delta computations.- Bid vs Ask (default)
- Up Tick vs Down Tick
What is Delta?
"Buying volume" and "selling volume" are conventional generic terms. Every trade always has two participants — buyer and seller. Delta is simply a way to indicate which side (buyer or seller) was the initiative side at the moment of the trade.There are two techniques to determine the instant initiative side of a trade — the "Bid vs Ask" technique and the "Up Tick vs Down Tick" rule.
The "Bid vs Ask" technique answers which side initiated the trade by comparing trade price with the established Best Bid and Best Ask at the trade moment:
Volume-based Delta = [Qty traded at or above Best Ask] − [Qty traded at or below Best Bid]
Tick-based Delta = [Num of Trades at Ask] − [Num of Trades at Bid]
The "Up Tick vs Down Tick" rule: volume traded on an up-tick (or after an up-tick, i.e. when price increases from the previous trade) is considered "Buying Volume", and volume traded on a down-tick (or after) is considered "Selling Volume".
Many old-school traders still prefer "Up Tick vs Down Tick", especially for high-volatility, low-volume futures where Best Bid and Best Offer change rapidly even with no trades and aren't very representative.
Some traders don't use Delta at all, only Volume-at-Price histograms. Since Delta is the most basic way to determine the urgent side over a short moment, it can be useful in a very short-term outlook but may say nothing about the bigger picture, which is much more important.
Anyway, it is important to understand that you should stick with one preferred Delta Mode and not use both at the same time when making trading decisions.
Delta Histograms
Delta analysis is mostly viable over a very short-term perspective (for scalpers or swift day traders). Nevertheless, Range Volume Profile can plot Volume-Delta At Price and Tick-Delta At Price as Delta Sub-bars and Delta Histograms.Both Delta Sub-Bars and Delta Histogram show the same thing. The only difference is that the Delta Histogram is customizable — its direction and horizontal scale can be adjusted, and it can be plotted alongside a hollow-style profile — while Delta Sub-bars are always plotted right over the Volume (or Tick) histogram bars, with each sub-bar scaled relative to its corresponding Volume (or Ticks) bar value. That is, delta at price is shown as a portion of volume (or ticks) at that price.
Filter: Mode
Sets the mode of filtering by trade size. Filter settings affect all kinds of profiles.- No Filtering
- Greater Than Or Equal
- Less Than Or Equal
- In Between
Naked Levels Cutoff Mode
Specifies whether RVP takes the whole candlestick range or ignores candlestick shadows when deciding if a Naked price level is touched by price.Appearance Settings
The Appearance settings sections contain properties common to all categories of profiles.Ascetic Mode
(1. Appearance Settings → 1. Frame → Ascetic Mode)Disabled by default. Ascetic Mode temporarily hides most UI elements except histograms and developing curves, to make the chart cleaner when necessary. It affects both Custom Range Profiles and Periodic Profiles.
Default shortcut key to toggle Ascetic Mode — [Ctrl + Alt + Divide on the numeric keypad].
Profile Summary Info
The Summary Info block provides basic summary information for a particular profile (whether Periodic or Custom Period Profile).Delta (Δ) values are colored depending on the accumulated delta value (negative / positive), using the same color properties as the Delta Histogram bars. It is possible to turn parts of the Summary Info block on/off on-the-fly through the RVP Control Panel [*] tab:
Expansions of the shorthand notations:
- ∑V — Total Volume (number of contracts) traded over the period.
- ΔV — Volume Delta over the period — the difference between total "buying volume" and total "selling volume".
- Pseudo-ΔV — Volume Pseudo-Delta — the difference between total volume of "bullish" and "bearish" minute intervals.
- ∑T — Total Trades (fills, filled orders, ticks, transactions, order executions) executed over the period.
- ΔT — Tick Delta — the difference between the number of "buying trades" and "selling trades".
- Pseudo-ΔT — Tick Pseudo-Delta — the difference between the count of "bullish" and "bearish" minute intervals.
- ATS — Average Trade Size — average number of contracts per trade during the period.
- ↕ — Price Range in $ (and in ticks in parentheses) = High − Low.
- H / L / O / C — High, Low, Open, Close of the period.
Profile Imbalance: the Summary Info also includes Volume- and Tick-based Profile Imbalances shown as a ratio (a simple fraction "Volume above POC : Volume below POC"), which is far easier to read than long numeric values — e.g. "5 : 9", "1 : 6" (read as "1 part of total volume above VPOC versus 6 parts below").
Large Numbers Shortening
In Summary Info, all total and delta values are printed in a shortened form, with the maximum degree of shortening set to "Billions" by default. You can change the maximum degree, or turn shortening off entirely:Local Peaks Highlighting
The 'Separate Color for Local Peaks' option in the Volume and Tick Profile appearance settings highlights local peaks on histograms with a custom color. The 'Local Peaks Detection Threshold' parameter controls sensitivity — the lower the threshold, the greater the sensitivity. Default threshold is 1.
Z-Order
What if a histogram overlaps the candlestick chart? In NinjaTrader you can change the z-order of price bars, indicator plots and other chart objects relative to each other. Bring the candlestick chart to the front using [Shift + Mouse Wheel] — select the price chart or object, hold Shift, and roll the scroll wheel to adjust the z-order.The standard way may not always work. In that case use the alternate command from the RVP Control Panel:
Separate Appearance Settings
The appearance properties defined in the '1. Appearance Settings' sections can have a global impact on all sorts of profiles. Optionally, separate appearance properties can be set specifically for:- Composite Profile — '1.3. CP Appearance Settings' section (enabled by default)
- Custom Range Profiles — '1.4. RPs Appearance Settings' section (enabled by default)
- Overnight Periodic Profiles — '1.2. PPs Appearance Settings' section (usable when working with a chart that has a custom multi-session Trading Hours template set)
Periodic Profiles
Computation and plotting of Periodic Profiles with "Sessional" periodicity is enabled by default.Periodicity Options
See 2. Periodic Profiles section → Periodic Profiles properties group → Periodicity property:- Per Bar
- Half-Hour
- Hourly
- Sessional (default)
- Daily
- Weekly
- Monthly
- Yearly
- N-Bars Step
- N-Sessions Step
Sessional
Set by default. If "Sessional" periodicity is selected, RVP uses the Trading Hours Template set for the chart's data series to establish periodic profiles.Trading Hour Templates contain the session start and end times of a specific market or group of instruments. All available templates can be accessed in the Trading Hours window (NinjaTrader Control Center → Tools → Trading Hours).
Split Overnight & Regular Sessions
NinjaTrader comes with predefined Trading Hour Templates for common instruments, and you can modify or create your own. This makes "Sessional" periodicity one of the most flexible options — for example, it can separate the Overnight session from the Regular (Pit / Open Outcry) session to get a trading day split into "Overnight" and "Pit" profiles on the same chart:For US Equity Futures, Regular Trading Hours (RTH) mostly applies to E-Mini Futures traded electronically (e.g. ES). RTH coincides with Open Outcry Trading Hours (Pit Session) of the base full-sized contracts (e.g. SP).
The following Trading Hours Template "CME US Index Futures ON+RTH" is used for this example:
Also, the 'Separate Appearance for Overnight PPs' option (see 1.2. PPS Appearance Settings) is enabled for this example.
To install the provided sample template, unpack and move the "CME US Index Futures ON+RTH.xml" file into "<Your PC>\Documents\NinjaTrader 8\templates\TradingHours", then restart NinjaTrader. The template will then be available in the Data Series settings window.
Daily
"Daily" periodicity may seem similar to "Sessional", but it is based on simpler logic that creates Daily profiles regardless of the current Trading Hours Template. It comes in handy when you need common Daily profiles on charts that have complex Trading Hours templates set.Per Bar
Because a huge number of profiles is usually created for "Per Bar" periodicity, mouse interaction and profile-related context-menu commands are disabled in this mode by default, for better performance. Turn them back on via RVP Control Panel → [*] tab → PPs Turn OFF Mouse Interaction checkbox. You may also want to adjust the horizontal position of Per Bar profiles using the PPs Histogram Shift slider.Note: even though RVP provides the "Per Bar" periodicity option, the Orderflow Bars NT8 indicator is specially adapted to work on a per-bar basis.
Half-Hour, Hourly
The "Half-Hour" and "Hourly" periodicity options are intended for intraday charts only.The arrangement base of Hourly and Half-Hour periodic profiles is the session beginning. This guarantees the same repeatable arrangement each time you open the chart / reload the indicator.
Weekly, Monthly, Yearly
Fairly self-explanatory. See the Non-intraday charts handling chapter below for more on working with non-intraday bars.N-Bars Step
"N-Bars Step" periodicity is coupled with the N-Bars Step number property and is intended for intraday charts only — it cannot be applied to non-intraday (e.g. Daily) charts. As with Hourly and Half-Hour profiles, bar counting is aligned to the session beginning to provide the same repeatable arrangement each reload.N-Sessions Step
This is an experimental periodicity. Unlike the others, it produces a non-repeatable arrangement because N-Sessions counting starts from the most recent (current) session — so you get an entirely different picture each new day / session.Comparative Widths Mode
All histograms plot with a specified uniform width, adjustable through the RVP Control Panel or shortcut keys. Comparative Widths mode instead scales Periodic Profile histograms by their summary volume, giving a quick overview of relative trading activity between periods:Use [Ctrl + Plus] and [Ctrl + Minus] shortcut keys to adjust the horizontal scale of Periodic Profiles.
Horizontal Alignment & Right Indent
The Horizontal Alignment of all Periodic Profiles is Left by default, but can be changed independently for the current (developing) profile and historical profiles through the RVP Control Panel (Periodic tab). You can also set a right-indent value for the right-aligned current profile (Periodic tab → Indent property).Periodic Profiles Info Sheet
RVP can compose an informational data sheet for Periodic Profiles as a plain-text, tab-separated table using system numeric and date-time formats, so it can be pasted straight into MS Excel or another spreadsheet for statistical analysis.The info sheet provides the following columns:
- Beginning Date & Time; End Date & Time
- Volume; Volume-Delta; Volume above VPOC; Volume below VPOC
- Ticks; Tick-Delta; Ticks above TPOC; Ticks below TPOC
- Open; Close; High; Low
- VPOC; VVAH; VVAL
- TPOC; TVAH; TVAL; VWAP; VWAP-StdDev
- Open Range High; Open Range Low; Initial Balance High; Initial Balance Low
Custom Range Profiles
Custom Range Profiles bring the most flexible way to reveal volume distribution and the related Value Area of any period you're interested in.Creation & Adjustment
To add a new Range Profile on the active chart, press the [Insert] shortcut key or use the 'Add Range Profile' command from the chart context menu:Then click on the chart to start creating the profile, move the mouse pointer, and click on the boundary to finish creation.
Both boundaries of any Custom Range Profile are adjustable with the mouse. Click a left or right boundary to grab it, move it to the desired location, and click again to finish the adjustment.
Range Profiles Controls
Interactive Buttons
While most Periodic Profile options are controlled through the RVP Control Panel, the options of each individual Range Profile are controlled with interactive buttons right on the chart.Most interactive buttons can also control the properties of all Range Profiles at once if clicked while holding [Shift]. For example, to adjust the histogram scale of all Range Profiles, hold [Shift] and click the [+]/[-] buttons of any custom range profile. Use a Middle Mouse Click on [+] or [-] to reset the histogram scale to default. (Alternatively use [Ctrl + Alt + Plus] to increase, [Ctrl + Alt + Minus] to decrease, [Ctrl + Alt + Multiply] to reset.)
"Real-time" Mode
You can switch a Range Profile to "real-time" mode, in which it develops with incoming live data. Middle-click any boundary, or click the [rt] button at the bottom-right corner, to "attach" the boundary to the current price bar:Additionally, a Right Indent can be set for right-aligned Range Profiles in "real-time" mode, both individually and overall. To set an individual Right Indent, use the [↔] button at the bottom of the profile:
To set the overall Right Indent, use the Right Indent for rt Mode field in the Custom Range tab of the RVP Control Panel:
Bracket Mode
Bracket Mode is an experimental mode of custom range profile in which the left boundary (and therefore the period) floats, dependent on one of four constraints: Limit by Volume, by Ticks, by Number of Bars, or Limit by Price Range.For example, in "Limit by Price Range" Bracket Mode, a range profile automatically tries to keep the price range less than or equal to the defined 'Price Range Limit' value (accuracy depends on the bar type — the shorter the timeframe, the closer the actual bracket range to the defined value).
Composite Profile
The purpose of the Composite Profile is to provide a basic overview of volume peaks and valleys in general.Updating the Composite Profile in real-time (with live data) is disabled by default, as it is unnecessary in most scenarios. To explicitly enable live updating, go to the Indicators window → 3. Composite Profile section → expand the Composite Profile properties group and check the Update Real-Time checkbox:
If you don't plan to use the Composite Profile, it is reasonable to turn off its computations entirely by unchecking the Enable checkbox in the Composite Profile settings section.
Period of Composite Profile
By default, the Composite Profile is built from all bars of the chart: Period Start = "Very First Bar" and Period End = "Very Last Bar".Important to note: setting the alternative options "First Visible Bar" for Period Start and/or "Last Visible Bar" for Period End can lead to frequent complete re-computations of the Composite Profile data and very intensive CPU usage. It is strongly recommended not to use these options on live charts, especially during periods of extreme trading activity / volatility.
High & Low Volume Nodes (HVNs & LVNs)
RVP can automatically determine and plot High and Low Volume Nodes (High and Low Tick Nodes if the selected profile type is Tick Profile) — simple price levels based on the peaks and valleys of the Composite Profile.The lower the Threshold Factor value, the more sensitive the peak/valley detection. Recommended values to experiment with lie in the range ~0.5…3. The default threshold is 1.1.
The Threshold Factor can be adjusted on-the-fly through the RVP Control Panel: type a new value and press Enter to apply. If the Update Real-Time option of the Composite Profile is enabled, the Volume Node price levels update live accordingly.
Price Levels System in Range Volume Profile
Value Area
Point Of Control, Value Area High and Value Area Low can be shown in two ways:- Horizontal level lines indicating current POC, VAH and VAL of the profile (enabled by default)
- Developing dPOC, dVAH and dVAL graphs (disabled by default)
Periodic Profiles: options are configured on-the-fly in the Periodic tab of the RVP Control Panel. Check Show dPOC and Show dVA to enable developing Value Area graphs for Periodic Profiles.
Plotting of Naked Value Area levels of Periodic Profiles is enabled by default. To disable, uncheck Show Naked POC and Show Naked VA in the Periodic tab:
Custom Range Profiles: click the dPOC and dVA interactive buttons of a Custom Range Profile to enable developing Value Area graphs for that profile. Plotting of Naked Value Area levels of Custom Range Profiles is disabled by default — to enable, click the NP and NV interactive buttons:
Value Area levels of any profile can be extended to the right edge of the chart: right-click over the profile to open its context menu, then click Extend VA Levels to Right:
Use the opposite command Cancel VA Levels Extension from the context menu to cancel the extension. You can also use [Ctrl + Shift + A] to toggle Value Area levels extension for all Periodic Profiles.
VWAP and VWAP Standard Deviation Bounds
Plotting of VWAP-related graphs is disabled by default.Periodic Profiles: check Show VWAP and Show VWAP StdDev Bounds in the Periodic tab of the RVP Control Panel to enable developing VWAP-based graphs. Check Show Naked VWAP and Show Naked VWAP StdDev Levels to enable plotting of Naked VWAP levels from each Periodic Profile.
Custom Range Profiles: click the VWAP and SD interactive buttons of a Custom Range Profile to enable developing graphs for that profile. Click NP and NV to plot VWAP-based Naked levels. As with Value Area levels, VWAP levels can be extended to the right edge via the Extend VWAP Levels to Right context command.
Appearance options and deviation factors of VWAP StdDev Bounds can be adjusted on-the-fly via the RVP Control Panel: switch to the Periodic tab and click 'Edit Appearance…' next to the Show VWAP checkboxes to open the VWAP Appearance editor:
Opening Range & Initial Balance
The Initial Balance (IB) concept was born in the era of Pit trading, when there was neither electronic trading nor real-time access to trading-activity data. Initial Balance is originally a price range established in the first hour of the Regular (Pit) session in CME or CBOT. Opening Range (OR) is a price range for a relatively short period after the market opens (usually 1–2 min).The first hour of the Pit session has the most importance because the most significant market players place orders in the morning — true in the days of Pit trading and in modern electronic trading.
A custom period can be set for Initial Balance and/or Opening Range in the 6. Extra Levels properties group of the 1. Appearance Settings section (or the corresponding separate Appearance Settings section if enabled):
Important! By default, the initial time point of OR and IB levels is the beginning of the profile, assuming a chart with an "RTH" Trading Hours template (Regular session). This default may not suit "Default 24x5", "Default 24x7", or "ETH" templates. In those cases, enable Use Custom Start Time for OR & IB and set a custom Start Time (usually the regular-session open — e.g. 9:30 AM ET for US Equity Index Futures).
Note: OR and IB levels are not displayed for the current (developing) profile until the specified Start Time in this case. If you enable Show IB After IB is Formed, Initial Balance levels become visible only after the IB period has elapsed, remaining hidden during IB formation.
By default, OR and IB price levels are disabled. Enable them for a particular profile via the profile context menu → Extra Levels → Initial Balance and Open Range. The IB Extensions menu item enables x1.5 and x2 Initial Balance extension levels (50% and 100% extensions). By default OR and IB levels are cut off at the end of the profile period but can be extended to the right edge via Extra Levels → Extend OR & IB.
Open, High, Low, Close, Middle
The Extra Levels context menu of a profile enables plotting of the common Open, High, Low, Close and Middle price levels of the profile period. By default, these levels are extended to the right edge.The start point of an Open, High, Low or Close level is the actual origin of that level. Hence, the Open level is plotted starting from the first bar of the period, the High level from the highest bar, and the Close level from the last (closing) bar. The Middle level is plotted from the beginning of the period, like the Open level.
Special Importance of the Current, Prior, 3rd and 4th Periodic Profiles
The last four Periodic Profiles (Current, Prior, 3rd and 4th) have special importance in terms of settings. Each has individual Extra Levels settings, allowing the individual states of extra levels of those four profiles to be saved/restored in/from a Workspace or Chart Template.Note: the Extra Levels states of other historical profiles (5th and older) are also controllable individually through the Extra Levels context menu, but these states are not saved individually in the Workspace — you must enable them again after restarting the chart or NinjaTrader.
Miscellaneous
Compatibility with bar types
Not all Data Series Types (bar types) are fully compatible with order-flow-based tools, depending on how they are constructed. For example, Line Break, Point & Figure and most Renko bar types affect the data flow in ways that make them technically unsuitable for order-flow tools. These bar types are actually self-sufficient studies intended to be used on their own.RVP can build historical profiles on some of these Data Series Types, but processing incoming live data isn't possible due to the specific impact on data caused by the bars' construction logic. (This is also why NinjaTrader's Tick Replay feature is disabled for some of these bar types.)
Bar types of this sort tend to produce bars with partially fake data points and may retroactively affect the volume of a finished bar during real-time computations (some internally use Ninja's RemoveLastBar() function). A price bar built this way may vary considerably from the actual price action during its formation — and the developing bar may even show larger volume than after it becomes historical. As a new bar builds, it can take ticks away from the previous bar; in effect, the past depends on the future. This 'inconsistent' way of building bars is the main obstacle to using such period types with order-flow tools, especially for live data. RVP constantly performs a basic consistency check of incoming real-time data and stops working when inconsistency is detected, to avoid showing unfair data.
Most Renko bar types, Line Break Charting and Point & Figure Charting can be excellent tools on their own, but should not be used in conjunction with order-flow tools due to how they are built. The developer also provides two volatility-based bar types — dt Reversal and cRenko (Consistent Renko) — that use adapted consistent logic which does not affect the data flow, so they are compatible with any order-flow tools.
Non-intraday charts handling
NinjaTrader uses three basic types of historical data: 1) Daily data, 2) 1-Minute granularity, 3) 1-Tick granularity. The last two are used to construct intraday charts (Minute, Tick, Range bars), and NinjaTrader takes customizable Trading Hours Templates into account when constructing them — so you control which session start/end times are used.Daily bars, however, are built from Daily data (Daily Open, High, Low, Close), which is data-vendor-specific and does not take a Trading Hours Template into account. Which session times your Daily bars are based on depends on your data provider, not your Trading Hours settings (most feeds use ETH hours for Daily bars). You cannot control the trading hours of Daily bars, so profiles may appear visually misaligned with Daily bars, because RVP always takes the selected Trading Hours Template into account.
If you add RVP to a non-intraday chart (e.g. Daily), you get a 'Reminder message' from RVP, and further data loading may pause until you close the reminder by clicking OK:
The Reminder window can be turned off: go to 5. Misc Settings → check Suppress Reminder Window for Non-intraday Charts → click OK, then re-save your Workspace:
A little tip: to get Daily-like bars that respect the selected Trading Hours, use Minute bars instead of Daily. For example, use 405-minute bars for RTH charts (15:15 − 8:30 = 405 minutes, the RTH session duration) and 1380-minute bars for ETH (23 hours × 60 = 1380 minutes).
Note: it may be reasonable to switch the 'Data Source' property to "Minute Series" when working with long-term profiles (Days to load > 60 days).

Last edited: